


We all dream of the simple life, where minimal effort results in massive income with no stress and all the free time we want – although on some days, we will settle for just one thing to go as planned. We all know the well-worn metaphor, “It’s like herding cats”. It is a picture of chaos; of something unmanageable, or nearly impossible to organise; of frantic chasing and very little success … a frustrating task involving a lot of variables all heading off to wreak havoc in their own direction. Dare I say that this is not a situation you want to encourage in your own business, especially when it comes to optimum transitioning.
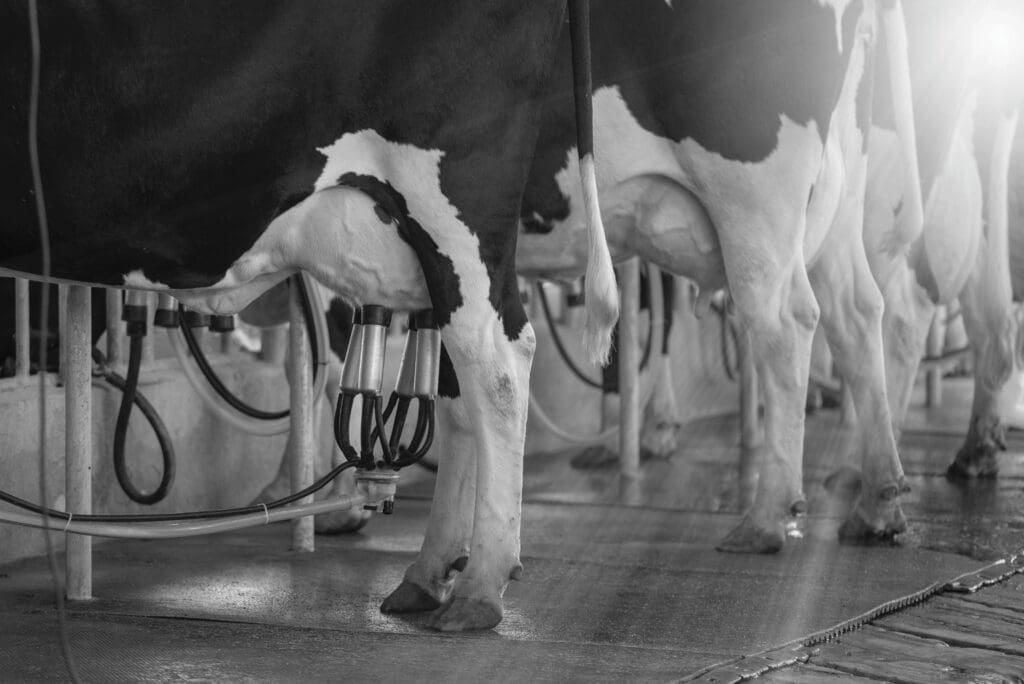
I have recently been doing a lot of thinking about how decisions are made on our dairy farms. There are often many variables that we try to measure, but we fail to corral them all together to get a clear picture of what we are dealing with. If we focus on only one area, such as feed cost per tonne, we could find ourselves making decisions that will ultimately hurt other, more important variables (like fertility) and what seems like a good decision today, might end up hurting us tomorrow.
The movement of cows from one lactation to another, the transition phase, is one such area in which I feel we might do well with a complete overhaul in our thinking. Over the next few editions, I would like to challenge your concepts around what you have always done. It is only by thinking about our thinking that we determine whether our thoughts are still valid. As time moves by and opportunities and ideas evolve, we need to ensure that our thoughts and our concepts keep up.
Factors in optimum transitioning
Before we start, let us have a look at all the factors involved in the successful transition of cows in our herd:
- Drying off the cows and the treatments associated with this action.
- Feeding a so-called low-quality ration for 39 days in the far-off period.
- Bringing cows into the close-up (steam-up) pen for 21 days before calving.
- The feeding costs of both rations.
- Ease of management.
- Your specific calving system.
- The veterinary and staff cost of complicated calvings.
- Colostrum and calf management.
- The cow’s ability to bounce back into lactation.
- Losses to transition diseases (you still pay for these, even though you do not actually transfer the money anywhere).
- The mental cost of having sick cows and a system that does not work for you.
There is too much going on here. We need simplicity!
Calculating costs
In order to calculate the cost of optimum transitioning vs suboptimum transitioning, I invite you to consider the following:
- Add together the direct costs as follows:
- Far-off feed cost per day × number of days
- + close-up feed cost per day × number of days
- + cost per treatment at dry-off (please note that I have purposely excluded vaccines from this cost as they are essential and not an area of cost saving)
- + cost of treatments at calving
- Add the costs of diseases
You have spent a lot of money getting her there, but how successful have you been (Table 1)? If we put a cost to each case (for example, 11 metritis cases × R2 780 = lots of money), we can start calculating what each month, or season, or year is actually costing. Now, divide the total cost by the number of cows in the herd to get an average cost per cow.
- Add it all up
When you add the direct and disease costs together, you get your transition invoice – a one-stop number that describes the whole situation. Your transition invoice is the cage for your cats!
| Disease (per case) | Cost (AUD) | Cost (ZAR) |
| Clinical milk fever | $350 | R3 800 |
| Subclinical milk fever | $60 | R650 |
| Retained foetal membranes | $315 | R3 420 |
| Metritis | $250 | R2 700 |
| Left displaced abomasum | $340 | R7 000 |
| Ketosis | $320 | R3 400 |
Practical example
Can you see from Table 2 that focusing on only the cost of your dry cow meal might lead you astray? Farm 2 thinks they are spending under R600 per cow when, in reality, they are actually spending almost R2 000!
| Farm | Direct costs | Disease costs | Transition invoice |
| Farm 1 | R1 428,11 | R3 127,12 | R4 555,23 |
| Farm 2 | R583,34 | R1 359,45 | R1 942,79 |
| Farm 3 | R1 436,60 | R1 192,50 | R2 629,10 |
Conclusion
We need to be able to measure the success of the entire system in order to understand if we are making the right call. If we never record the illness rate on our farm, how will we know if we are fixing anything? Use Table 3 to calculate your own transition invoice. Only then will you be able to corral the cats and keep them all moving in a predictable direction towards optimum transitioning.
| Cost/case (ZAR) | x Number of cases per year | = Total cost of treatment | |
| Clinical milk fever | R3 800 | ||
| Subclinical milk fever (rule of thumb = 9,75 x number of clinical cases) | R650 | ||
| Retained foetal membranes | R3 420 | ||
| Metritis | R2 700 | ||
| Left displaced abomasum | R7 000 | ||
| Ketosis | R3 400 | ||
| Death | |||
| Annual losses to transition diseases | |||
| Cost per cow in milk |


Alex Jenkins is a technical specialist in the ruminant team at Chemuniqué and holds a master's degree in animal science from the University of KwaZulu-Natal.
Nicely written article, Alex, well done.
A LOT of work went into that very well presented article. Great stuff!